
Sentry
Sentry
Sentry is a full-stack application monitoring platform offering error tracking, performance monitoring, session replay, uptime checks, and profiling to accelerate debugging and optimize user experience.
Key Features
- Error Monitoring
- Performance Monitoring
- Release Health
- Uptime Monitoring
- Session Replay
- Profiling
- Alerts & Notifications
- Discover & Dashboards
- AI Issue Assist
What Is Sentry?
Sentry is an open-source-based application monitoring platform that captures errors, performance issues, and user sessions across frontend, backend, mobile, and cloud environments. By integrating lightweight SDKs into applications, Sentry aggregates errors with full context-stack traces, local variables, user data, and release annotations-enabling rapid root-cause analysis and streamlined debugging workflows.
Pros and Cons
Pros
- Real-time error detection with intelligent grouping
- End-to-end distributed tracing and performance metrics
- Session Replay for frontend issue reproduction
- Uptime Monitoring with flexible alert conditions
- Code-level profiling to pinpoint slow functions
- AI-powered Issue Assist suggests assignees and fixes
- Rich Discover queries and customizable dashboards
- Extensive integration ecosystem
- Scalable usage-based pricing
Cons
- Complex setup for advanced distributed tracing in large microservices
- Usage costs can spike with high event volumes
- Learning curve for power users configuring Discover queries
- No native desktop application (web-only interface)
Who It’s For
Sentry serves individual developers, small teams, and enterprises seeking unified observability. It is ideal for web and mobile engineers, DevOps teams, site reliability engineers, and product managers who require real-time insights, context-rich error data, and performance monitoring within a single platform.
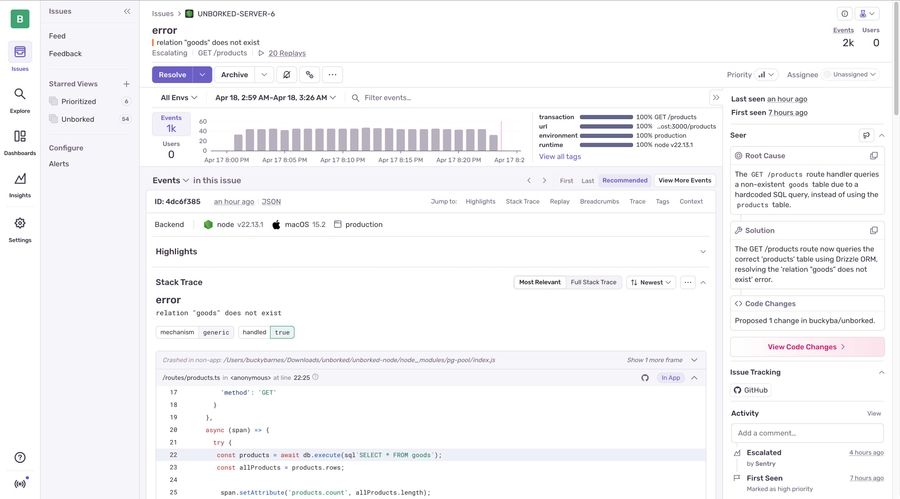
Error Monitoring
Automatically captures unhandled exceptions and grouped issues by root cause. Provides detailed stack traces, local variable snapshots, and suggest assignees based on suspect commits and code owners.
Performance Monitoring
Enables distributed tracing across services and databases to measure transaction throughput and latency. Drill into slow spans and endpoints to identify performance bottlenecks.
Release Health
Tracks release adoption, crash-free sessions, and error trends over time. Correlates issues with specific releases to pinpoint regressions quickly.
Uptime Monitoring
Configures HTTP checks and cron monitors to verify service availability. Sends alerts via email or integrations when endpoints fail or performance degrades.
Session Replay
Records and replays end-user sessions alongside error events to reproduce frontend bugs accurately. Captures DOM changes, console logs, and network activity.
Profiling
Profiles production code at the function level to surface CPU- and memory-intensive operations. Helps optimize slow methods and critical code paths.
Alerts & Notifications
Offers flexible alert rules-error rate thresholds, anomaly detection, and custom tag conditions. Integrates with Slack, PagerDuty, email, and more for instant notifications.
Discover & Dashboards
Provides a SQL-like query interface to explore events and performance data. Build custom dashboards for service health, error trends, and usage metrics.
AI Issue Assist
Leverages AI to suggest root causes, likely assignees, and remediation steps based on code context and historical resolutions.
Pricing
- Developer (Free): 5,000 events/month; unlimited users; 30-day data retention.
- Team: $26/user/mo; 50,000 events/month; 90-day retention; unlimited users.
- Business: $80/user/mo; 200,000 events/month; 180-day retention; advanced SLAs.
- Enterprise: Custom pricing; unlimited events; 24-month retention; dedicated support and SLAs.
Verdict
Sentry stands out as a unified observability solution, combining robust error tracking and performance monitoring with session replay, profiling, and AI enhancements. Its flexible integrations and usage-based pricing make it adaptable from solo developers to large organizations. While advanced tracing and high-volume usage require careful planning, Sentry’s context-rich data and powerful dashboards deliver unmatched debugging efficiency and application reliability.
Frequently Asked Questions about Sentry
What Is Sentry?
Sentry is an open-source-based application monitoring platform that captures errors, performance issues, and user sessions across frontend, backend, mobile, and cloud environments. By integrating lightweight SDKs into applications, Sentry aggregates errors with full context-stack traces, local variables, user data, and release annotations-enabling rapid root-cause analysis and streamlined debugging workflows.
Pros and Cons
Pros
- Real-time error detection with intelligent grouping
- End-to-end distributed tracing and performance metrics
- Session Replay for frontend issue reproduction
- Uptime Monitoring with flexible alert conditions
- Code-level profiling to pinpoint slow functions
- AI-powered Issue Assist suggests assignees and fixes
- Rich Discover queries and customizable dashboards
- Extensive integration ecosystem
- Scalable usage-based pricing
Cons
- Complex setup for advanced distributed tracing in large microservices
- Usage costs can spike with high event volumes
- Learning curve for power users configuring Discover queries
- No native desktop application (web-only interface)
Who It’s For
Sentry serves individual developers, small teams, and enterprises seeking unified observability. It is ideal for web and mobile engineers, DevOps teams, site reliability engineers, and product managers who require real-time insights, context-rich error data, and performance monitoring within a single platform.
Error Monitoring
Automatically captures unhandled exceptions and grouped issues by root cause. Provides detailed stack traces, local variable snapshots, and suggest assignees based on suspect commits and code owners.
Performance Monitoring
Enables distributed tracing across services and databases to measure transaction throughput and latency. Drill into slow spans and endpoints to identify performance bottlenecks.
Release Health
Tracks release adoption, crash-free sessions, and error trends over time. Correlates issues with specific releases to pinpoint regressions quickly.
Uptime Monitoring
Configures HTTP checks and cron monitors to verify service availability. Sends alerts via email or integrations when endpoints fail or performance degrades.
Session Replay
Records and replays end-user sessions alongside error events to reproduce frontend bugs accurately. Captures DOM changes, console logs, and network activity.
Profiling
Profiles production code at the function level to surface CPU- and memory-intensive operations. Helps optimize slow methods and critical code paths.
Alerts & Notifications
Offers flexible alert rules-error rate thresholds, anomaly detection, and custom tag conditions. Integrates with Slack, PagerDuty, email, and more for instant notifications.
Discover & Dashboards
Provides a SQL-like query interface to explore events and performance data. Build custom dashboards for service health, error trends, and usage metrics.
AI Issue Assist
Leverages AI to suggest root causes, likely assignees, and remediation steps based on code context and historical resolutions.
Pricing
- Developer (Free): 5,000 events/month; unlimited users; 30-day data retention.
- Team: $26/user/mo; 50,000 events/month; 90-day retention; unlimited users.
- Business: $80/user/mo; 200,000 events/month; 180-day retention; advanced SLAs.
- Enterprise: Custom pricing; unlimited events; 24-month retention; dedicated support and SLAs.
Verdict
Sentry stands out as a unified observability solution, combining robust error tracking and performance monitoring with session replay, profiling, and AI enhancements. Its flexible integrations and usage-based pricing make it adaptable from solo developers to large organizations. While advanced tracing and high-volume usage require careful planning, Sentry’s context-rich data and powerful dashboards deliver unmatched debugging efficiency and application reliability.