Datadog
Datadog
Full-stack cloud monitoring and security platform offering infrastructure metrics, APM, logs, synthetics, RUM, and security telemetry in one SaaS solution.
Key Features
- Infrastructure Monitoring
- Application Performance Monitoring (APM)
- Log Management
- Synthetic Monitoring
- Real User Monitoring (RUM)
- Security Monitoring
- Cloud SIEM
- Network Performance Monitoring
- Database Monitoring
- CI Visibility
- Incident Management
- Workflow Automation
- Custom Metrics
- Dashboards & Alerts
- Service Catalog
What Is Datadog?
Datadog is a cloud-based observability platform that collects and correlates metrics, logs, traces, and security signals from across your entire stack in real time. Deployed via lightweight agents, APIs, or vendor SDKs, Datadog ingests data from servers, containers, cloud services, applications, and user-facing experiences. Unified dashboards, advanced analytics, and AI-powered alerts across telemetry types enable teams to troubleshoot faster, optimize performance, and secure environments without tool sprawl.
Pros and Cons
Pros
- Comprehensive full-stack visibility in one pane
- 900+ turnkey integrations for rapid onboarding
- High-resolution metrics, logs, and traces with correlation
- AI-driven anomaly, outlier, and forecast alerting
- Scalable SaaS architecture with global data centers
Cons
- Usage-based pricing can escalate quickly at scale
- Complexity of product breadth may require steep learning curve
- Host-based billing may penalize dynamic containerized workloads
- Enterprise features (e.g., Cloud SIEM) require add-on licensing
Who It’s For
Datadog serves:
- DevOps & SRE Teams needing unified infrastructure and APM telemetry
- Platform & Cloud Engineers monitoring hybrid and multi-cloud environments
- Security & SecOps Teams integrating threat detection with monitoring
- Dev Teams tracing distributed applications end to end
- IT Ops & NOC requiring synthetic and real user monitoring for SLAs
Infrastructure Monitoring
Collects CPU, memory, network, and disk metrics plus OS-level and container telemetry. Preconfigured and custom dashboards provide granular views by host, container, or tag.
Application Performance Monitoring (APM)
Traces requests across microservices and serverless functions. Root-cause analysis highlights latency hotspots and error rates. Supports OpenTelemetry, auto-instrumentation, and custom spans.
Log Management
Ingests, parses, and indexes logs with live tailing, enrichment, and faceted search. Correlate logs to metrics and traces for rapid triage and detailed forensics.
Synthetic Monitoring
Runs automated API and browser tests to proactively verify endpoints and transaction flows. Global and private locations, reusable assertions, and uptime alerts ensure reliability.
Real User Monitoring (RUM)
Captures end-user session data—page loads, resource timings, errors—and correlates with backend traces. Analyze user journeys, performance bottlenecks, and conversion issues.
Security Monitoring
Detect threats and misconfigurations by blending logs, network data, and host metrics. Built-in rules, custom detections, and Cloud SIEM workflows centralize alerting and incident response.
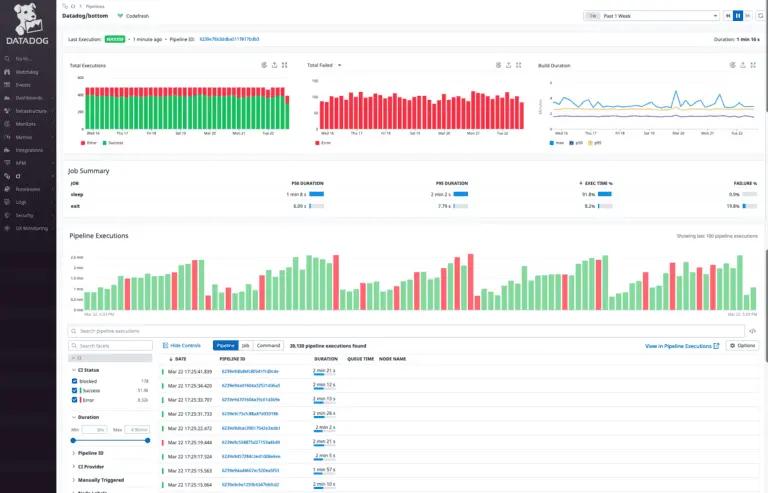
CI Visibility
Monitors CI pipelines and test results to identify flaky tests, bottlenecks, and failures. Integrates with Jenkins, GitHub Actions, GitLab CI, and other tools.
Pricing
- Free Trial: 14 days with full feature access, then free tier for up to 5 hosts monitored.
- Pro: $15 per host/month (billed annually); includes Infrastructure, APM, Logs (7-day retention), Synthetics (API), 100 custom metrics, basic security monitoring.
- Enterprise: Custom pricing; adds extended log retention, RUM, Security Monitoring & Cloud SIEM, Incident Management, CI Visibility, premium support, and volume discounts.
Verdict
Datadog excels as an all-in-one observability and security solution, reducing tool fragmentation and enabling cross-functional teams to collaborate on a single platform. Its extensive integrations, unified telemetry, and AI-powered alerting make it ideal for cloud-native, containerized, and distributed architectures. Organizations should evaluate usage patterns and optimize telemetry to manage costs effectively.
Frequently Asked Questions about Datadog
What Is Datadog?
Datadog is a cloud-based observability platform that collects and correlates metrics, logs, traces, and security signals from across your entire stack in real time. Deployed via lightweight agents, APIs, or vendor SDKs, Datadog ingests data from servers, containers, cloud services, applications, and user-facing experiences. Unified dashboards, advanced analytics, and AI-powered alerts across telemetry types enable teams to troubleshoot faster, optimize performance, and secure environments without tool sprawl.
Pros and Cons
Pros
- Comprehensive full-stack visibility in one pane
- 900+ turnkey integrations for rapid onboarding
- High-resolution metrics, logs, and traces with correlation
- AI-driven anomaly, outlier, and forecast alerting
- Scalable SaaS architecture with global data centers
Cons
- Usage-based pricing can escalate quickly at scale
- Complexity of product breadth may require steep learning curve
- Host-based billing may penalize dynamic containerized workloads
- Enterprise features (e.g., Cloud SIEM) require add-on licensing
Who It’s For
Datadog serves:
- DevOps & SRE Teams needing unified infrastructure and APM telemetry
- Platform & Cloud Engineers monitoring hybrid and multi-cloud environments
- Security & SecOps Teams integrating threat detection with monitoring
- Dev Teams tracing distributed applications end to end
- IT Ops & NOC requiring synthetic and real user monitoring for SLAs
Infrastructure Monitoring
Collects CPU, memory, network, and disk metrics plus OS-level and container telemetry. Preconfigured and custom dashboards provide granular views by host, container, or tag.
Application Performance Monitoring (APM)
Traces requests across microservices and serverless functions. Root-cause analysis highlights latency hotspots and error rates. Supports OpenTelemetry, auto-instrumentation, and custom spans.
Log Management
Ingests, parses, and indexes logs with live tailing, enrichment, and faceted search. Correlate logs to metrics and traces for rapid triage and detailed forensics.
Synthetic Monitoring
Runs automated API and browser tests to proactively verify endpoints and transaction flows. Global and private locations, reusable assertions, and uptime alerts ensure reliability.
Real User Monitoring (RUM)
Captures end-user session data—page loads, resource timings, errors—and correlates with backend traces. Analyze user journeys, performance bottlenecks, and conversion issues.
Security Monitoring
Detect threats and misconfigurations by blending logs, network data, and host metrics. Built-in rules, custom detections, and Cloud SIEM workflows centralize alerting and incident response.
CI Visibility
Monitors CI pipelines and test results to identify flaky tests, bottlenecks, and failures. Integrates with Jenkins, GitHub Actions, GitLab CI, and other tools.
Pricing
- Free Trial: 14 days with full feature access, then free tier for up to 5 hosts monitored.
- Pro: $15 per host/month (billed annually); includes Infrastructure, APM, Logs (7-day retention), Synthetics (API), 100 custom metrics, basic security monitoring.
- Enterprise: Custom pricing; adds extended log retention, RUM, Security Monitoring & Cloud SIEM, Incident Management, CI Visibility, premium support, and volume discounts.
Verdict
Datadog excels as an all-in-one observability and security solution, reducing tool fragmentation and enabling cross-functional teams to collaborate on a single platform. Its extensive integrations, unified telemetry, and AI-powered alerting make it ideal for cloud-native, containerized, and distributed architectures. Organizations should evaluate usage patterns and optimize telemetry to manage costs effectively.